
Last year the “old” Google Analytics – Universal Analytics or UA – stopped collecting any more data. From 1st July 2024, they will no longer provide access to the old data and will be deleting it from their system.
Why is this important?
Collecting website statistics allows you to be able to compare different date ranges and see how behaviour on the website has changed over time – are you getting more visitors now, are they visiting different pages than before etc.
With the removal of UA data, unless you take action, you’ll only be able to go as far back as the data you have in the latest version of Analytics – Google Analytics 4.

What can you do?
Firstly, do you really need it? Is retaining website activity that is multiple years old actually useful, or is it just going to sit in a batch of files somewhere unviewed and unloved? Exact like for like comparisons between UA and GA4 aren’t possible, and the disruptions of the pandemic would also mean issues comparing like with like over multiple years.
If you do want to keep it, decide what data is important for you. UA held a huge amount of information that the vast majority of users never viewed. As a basic starter, for most people important information was how many site visitors, how they found your site, and which pages were viewed. But is knowing which countries people visited you from or changes in mobile vs desktop access also important?
You should also consider how granular you need the data – this could be monthly for something like site visitors, but for country visits it could be annual.
Lastly, how will you want to use that data in the future. E.g. would a PDF of a graph of visitors per month be OK, or is it something you want to regularly compare to more recent data? If the latter you’ll want the data in a spreadsheet so you can run your own analysis.
How Do I Do It? The Basic Option
This is going to depend on exactly what you want to keep, but for a basic overview of site performance it will be exporting to multiple PDF files.
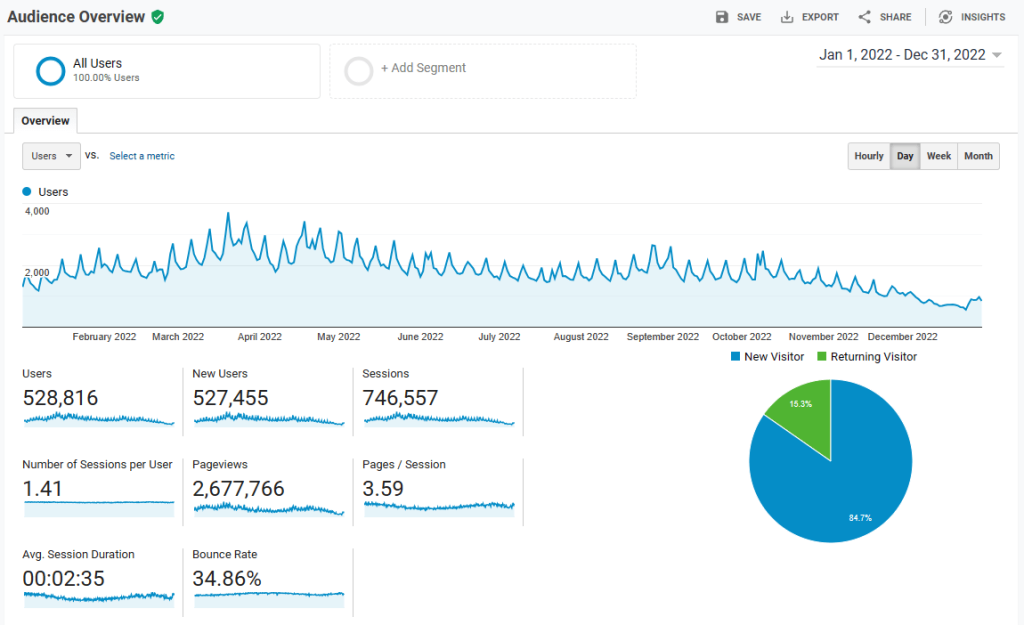
To do this, log in to your Google Analytics account, and go to Audience: Overview. Select the required date range at the top right. You may want to export multiple of these reports, one for each year. Select Export : PDF to create your file.
We’d recommend repeating this process for the Acquisition: All Traffic: Channels, and Source / Medium reports and the Behaviour: Site Content: All Pages and Landing Pages reports.
This will give a basic overview of site performance and behaviour per year. You may want to increase the number of rows shown to give greater insight (especially for page data) as 10 can be quite limiting.